Research Article | | Peer-Reviewed

Dam Breach Flood Prediction and Mapping: A Case Study of Gomit Small Dam, Amhara Region

Received: 18 October 2025     Accepted: 30 October 2025     Published: 19 December 2025
Views:       Downloads:
Abstract

The Gomit Earth Dam, constructed for irrigation, is currently in a critical state due to structural damage and exposure of the clay core, posing a significant risk of catastrophic failure. This study simulates the potential breach flood under probable maximum flood (PMF) conditions and delineates flood inundation extents to assess impacts on downstream areas and inform mitigation strategies. The research employs five key software tools: Global Mapper, ArcGIS, HEC-RAS, HEC-GeoRAS, and RAS Mapper to model dam breach hydraulics and map flood inundation. Field-surveyed topographic data with 20-m interval cross-sections were used to create accurate terrain representations. Simulations were conducted for two scenarios: sunny day failure and PMF failure, with detailed flood hazard analysis focusing on the PMF scenario. Results indicate a peak breach outflow of 1914.26 m3/s, 1.28 times greater than sunny day failure and 18.65 times the PMF inflow, with flood depths ranging from 7.06 m near the dam to 0.72–1.58 m across overbanks downstream. Flow velocities reached up to 12.32 m/s, and the flood wave arrival time varied from 0.077 to 0.386 hours after breach initiation. The inundated area totals approximately 38.92 hectares, representing 32.44% of the irrigated command area, with significant implications for agriculture, infrastructure, and community safety. Approximately 26 households, totaling over 100 people, are at high risk of life-threatening impacts, food insecurity, and property damage. This study underscores the urgent need for structural maintenance, early warning systems, and community-based flood risk management. Limitations include a lack of observed flood data for model calibration and consideration of a single flood scenario. Future research should incorporate multiple breach scenarios, long-term monitoring, and the impacts of climate variability to enhance the preparedness and resilience of irrigation infrastructure.

Published in Research and Innovation (Volume 1, Issue 1)
DOI 10.11648/j.ri.20250101.21
Page(s) 83-99
Creative Commons

This is an Open Access article, distributed under the terms of the Creative Commons Attribution 4.0 International License (http://creativecommons.org/licenses/by/4.0/), which permits unrestricted use, distribution and reproduction in any medium or format, provided the original work is properly cited.

Copyright

Copyright © The Author(s), 2025. Published by Science Publishing Group

Keywords

Dam Breach, Flood Inundation, Hydraulic Modeling, Probable Maximum Flood

1. Introduction
Water infrastructure, such as dams, plays a pivotal role in ensuring water supply, flood regulation, irrigation, and energy production, especially in developing countries striving to achieve food security and sustainable development . In Ethiopia, a country heavily dependent on rain-fed agriculture, the construction of small to large dams has become a cornerstone of national development strategies aimed at mitigating the impacts of climate variability and enhancing agricultural productivity . However, the failure of dam structures can lead to catastrophic consequences, including loss of life, destruction of property, and long-term environmental damage .
Dam failure-induced floods are particularly dangerous due to their sudden onset, high peak flows, and limited warning times. Compared to floods caused by meteorological events, such as heavy rainfall, those triggered by dam breaches often produce significantly higher discharge magnitudes and shorter response times, leaving downstream communities with minimal opportunity for evacuation . Historical data indicate that over 60% of fatalities associated with dam failures worldwide occurred in just three incidents . The major causes of failure include overtopping due to insufficient spillway capacity (34%), foundation defects (30%), and piping or seepage (28%) . These statistics highlight the critical importance of incorporating robust safety measures, such as Emergency Action Plans (EAPs) and dam breach analyses, in dam design and operation.
Despite Ethiopia’s ambitious investment in water infrastructure, including projects like Gibe I–III, Tekeze, Koga, and Rib Dams, there remains a lack of systematic planning and preparedness for dam failure scenarios. Many existing and newly constructed dams do not incorporate pre-event dam breach modeling or hazard assessments as part of the standard design and management protocol. The absence of EAPs, coupled with limited institutional capacity, has increased the vulnerability of downstream populations to dam-related disasters .
The Gomit Earth Dam, constructed in 2002 E.C. (2010 G.C.) by the Commission for Sustainable Agricultural and Environmental Rehabilitation for the Amhara Region (COSAERAR), is situated in a drought-prone area where water storage is vital for supporting livelihoods. However, over time, the dam has shown signs of structural degradation, particularly near its river centerline, raising serious concerns about its potential failure. Alarmingly, no prior dam breach analysis or inundation mapping has been conducted for this structure. The lack of safety-focused investments and emergency planning indicates institutional gaps in dam risk management. This is particularly concerning given that failure of the Gomit Dam would likely result in catastrophic flooding with severe consequences for downstream communities.
To reduce the potential risks posed by such infrastructure, dam breach modeling and inundation mapping are critical tools. These methods allow for the simulation of dam failure scenarios and provide vital information on flood wave travel times, depths, and extents. Such data are indispensable for designing early warning systems, evacuation plans, and mitigation strategies to protect human life and property . International best practices recommend that dam safety evaluations include both physical and numerical modeling to estimate the impact zones, develop inundation maps, and implement community-based disaster preparedness plans .
This study aims to assess the consequences of a potential breach of the Gomit Earth Dam by simulating dam failure scenarios under both sunny-day and probable maximum flood (PMF) conditions using hydrologic and hydraulic models. It further seeks to generate dam breach outflow hydrographs, analyze flood wave travel time and inundation depths, and produce hazard maps that delineate the extent of downstream flooding. In doing so, the study provides actionable insights for emergency management planning and proposes mitigation strategies to reduce the risks associated with dam failure. The findings are expected to fill a critical knowledge gap in dam safety assessment in Ethiopia and serve as a model for future assessments of similar small- and medium-scale dams across the region.
2. Methods and Materials
2.1. Description of the Study Area
Gomit Dam is found in the Amhara Region, South Gondar Administration Zone, Estie woreda, about 7 km from the capital of the Woreda in the South direction. The geographical location as shown in Figure 1 of the Gomit Small Dam irrigation Project Reservoir (at Dam axis) is Longitude: 380 01’00’’E, Latitude: 11033’43’’N, and Altitude: 2375m.a.s.l.
Gomit catchment has a total area of 23.6km2, composed of undulating and rolling plain 43.6%, hilly 37.76%, & flat plain 18.60% of the total catchment area. These landforms, particularly the hills, are found scattered in the watershed. The catchment is surrounded by chains of hills forming a concave shape. This has an advantage for creating a high runoff rate. The catchment ranges in elevation from 2700m.a.s.l at the north boundary to about 2366 m at the reservoir .
According to the design, the proposed Gomit Dam is a zoned embankment dam with a height of 20m and a crest length of 324m, featuring a 2:1 upstream side slope. A riprap material of poorly graded material is provided to protect against the erosive action of waves on the upstream side, and protection grass is used on the downstream side. The MWL is 2369.36m.a.s.l, NWL, 2367.00m.a.s.l, MDDL, 2359.00m.a.s.l. At maximum and normal reservoir levels, the size of the reservoir area inundated is 25.5ha and 19.418ha, respectively. The storage capacity of the reservoir at NWL is 102. 08ha.m (1,020,800m3) at MDDL 10.98ha.m (109,800m3) and at MWL is 154.97ha.m (1,549,700m3) the total embankment volume is 93,236.76m3.
Both the spillway and irrigation outlet of Gomit Dam is located on the left side of the bank. The spillway is an ogee type with crest length of 25m and crest level of 2367.00m a.s.l. designed to convey safely maximum designed flood of 87.84m3/sec at 2368.2m.a.s.l. Out let works are provided and it is made of steel pipe with 0.60m in diameter the inlet level to the irrigation pipe outlet is 2359.00m a.s.l, in addition trash racks, collard, stilling basin and valves are also provided. It is a strong project to be constructed on the river Gomit to irrigate 90ha of agricultural land by impounding the flood for dry season irrigation which 360 households to be benefited .
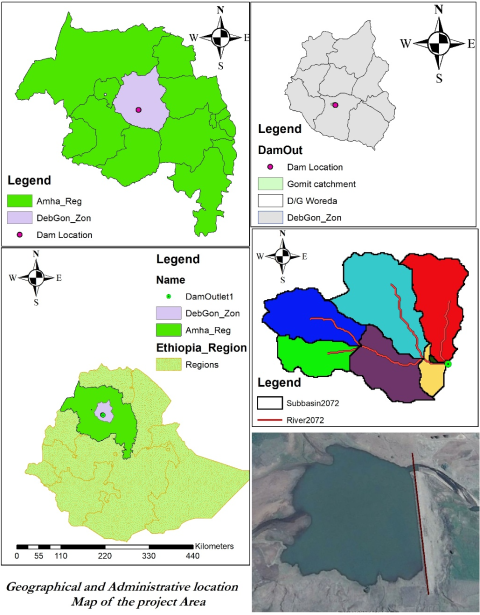
Figure 1. Location Map of the study area.
2.2. Data Collection
Data required for the hydrologic and hydraulic modeling of the dam breach scenarios were obtained from both primary field surveys and various secondary institutional sources.
2.2.1. Primary Data Collection
Primary data were collected through direct field surveys and on-site investigations. These included detailed topographic data of the floodplain area, cross-sectional profiles of the river from the dam site downstream, and reservoir characteristics such as water surface elevation and volume at the onset of breaching. Field observations were also used to estimate Manning’s roughness coefficients based on surface conditions, vegetation cover, and channel characteristics. In addition, a site visit was conducted to assess the current condition of the dam and identify areas at risk. Land use and land cover data were verified through field assessments supported by recent satellite imagery.
2.2.2. Secondary Data
For this study, Secondary data were obtained from relevant institutions, including the Amhara Design and Supervision Works Enterprise (ADSWE), the Bureau of Water Resource Development (BOWRD), and the National Meteorological Agency. These included the dam’s design flood (PMF), structural features (crest level, dam height, crest length, and spillway size), and breach parameters estimated using regression equations based on standard guidelines. A detailed design report of the Gomit Dam was a key source, providing comprehensive information on watershed characteristics, reservoir geometry, spillway design, and dam specifications. Additional secondary sources comprised the original topographic and geological investigation reports, watershed management plans, and headwork design documents. Meteorological data, including daily rainfall, temperature, relative humidity, wind speed, and sunshine hours, were collected from nearby stations such as Debre Tabor, Woreta, Wanzaye, and Mekaneyesus (Estie). Digital elevation models (ASTER DEM) and satellite imagery were also used for terrain analysis and floodplain mapping.
2.3. Methods of Data Analysis
2.3.1. Hydrologic Modeling and PMF Estimation
Hydrologic analysis for this study was conducted to estimate the Probable Maximum Flood (PMF) resulting from the Probable Maximum Precipitation (PMP), to support dam breach modeling. Hydrologic modeling was performed using HEC-HMS, incorporating revised input data to account for land-use changes and the proximity of rainfall stations.
According to the original Gomit Hydrology report, the design probable maximum precipitation (PMP) was estimated to be 87.43 mm for a 100-year return period, based on rainfall data from the Debre Tabor meteorological station, located approximately 32.09 km from the study area. However, due to the distance from the dam site, this data source may introduce significant discrepancies in the computed probable maximum flood (PMF). Additionally, the design was originally conducted in 2001 G.C., and over the past two decades, major changes may have occurred in land use, land cover, and soil conditions, all of which directly influence runoff generation. These changes necessitate a revision of the hydrologic design to ensure accuracy and relevance.
To address these limitations, the PMP was recalculated using precipitation data from the Mekaneyesus meteorological station, located only 6.72 km from the study site, making it more representative of the current watershed conditions. PMP values for the 100-year return period were estimated using five widely recognized statistical frequency analysis methods: Normal Distribution, Log-Normal Distribution, Log Pearson Type III Distribution, Pearson Type III Distribution and Gumbel (Extreme Value Type I) Distribution.
To identify the best-fitting method, the D-index was used as a performance criterion, which measures the absolute deviation between the estimated and observed extreme rainfall values. Among the methods, the Gumbel (EV-I) distribution produced the largest PMP value and the lowest D-index, confirming its suitability for extreme rainfall estimation in the study area.
The PMF was estimated using the Soil Conservation Service (SCS) Curve Number method, which relates runoff to rainfall, land use, and soil characteristics. The equation used was
Qe=P-0.2S2P+0.8S(1)
Where: Qe is direct runoff (mm), P (mm) is depth of precipitation, and S (mm) is catchment maximum potential retention, which is related to Curve Number CN and calculated using Equation (2).
S= 1000CN-10(2)
Where CN is for the normal antecedent moisture conditions (AMC II), for dry conditions (AMC I) or wet conditions (AMC III), equivalent curve numbers can be computed using Equations (3) and (4), respectively.
CN I=4.2CN II10-0.058CN II(3)
CN III=23CN II10-0.13CN II(4)
To determine the representative CN value of a basin, the basin area has to be divided into sub-areas, which have the same land use and soil type characteristics. Then, CN values for every sub-area are determined using Arc Hydro and Hec-GeoHms extension in Arc GIS. After the determination of CNs for particular sub-areas, the weighted average of the CN values concerning their areas will give the representative CN value for the whole basin. This process can now be easily performed with the aid of GIS software .
The time of concentration, which influences the shape and timing of the hydrograph, was calculated using Kirpich’s equation.
TC= 13000LS0.50.77(5)
Using the calculated runoff volume and time parameters, the inflow hydrograph was generated in HEC-HMS. A triangular unit hydrograph, based on the SCS methodology, was used to convert rainfall excess into direct runoff. This hydrograph served as the basis for routing flows into the reservoir and simulating potential dam breach scenarios.
This integrated and updated hydrologic modeling approach ensures that the PMF estimation reflects the current environmental and meteorological conditions of the Gomit watershed and supports more accurate dam safety assessments.
2.3.2. Breach Parameter Estimation
In dam break analysis, estimating breach parameters is a critical component that significantly influences the accuracy of hydraulic modeling and flood routing. Since direct prediction of breach geometry and timing is inherently uncertain, empirical equations are commonly used based on historical dam failure data and reservoir conditions.
For this study, breach dimensions and breach formation time were estimated using regression-based equations, which are widely recommended due to their relatively low uncertainty and strong empirical foundation. These equations were selected based on their applicability to earth-fill dams and their alignment with international guidelines for dam breach studies .
Breach dimensions and formation time were determined using empirical equations developed by .
The average breach width was calculated as
Bavg=0.27KoVW0.32hb0.04(6)
and the breach formation time was estimated as
tf=63.2Vwghb2(7)
Where Vw is the water volume above the breach invert, and hb is the height of water above the breach bottom, Ko is 1.3 for overtopping and 1 for piping. The equations require input variables that describe the reservoir geometry and storage conditions at the time of failure. These were derived from dam geometry, storage-elevation relationships, and assumed breach initiation scenarios (e.g., overtopping or structural damage). Breach side slopes were assumed based on international dam safety guidelines, and the final breach bottom elevation was selected relative to the current sedimentation level or structural foundation of the dam.
To evaluate the dam break under different conditions, two failure scenarios were modeled: Failure at Normal Water Level (sunny-day failure) and Failure during a Probable Maximum Flood (PMF) event.
For each scenario, the computed breach parameters were used as inputs into the HEC-RAS unsteady flow simulation module to simulate breach development and downstream flood propagation. Where field-observed breach damage was available, sensitivity analysis was also conducted to compare the empirical estimates against actual geometries.
2.3.3. Hydraulic Modeling Using HEC-RAS
Hydraulic modeling was conducted using HEC-RAS 1D unsteady flow simulations to evaluate the downstream propagation of the dam breach hydrograph. The model employs the full Saint-Venant equations of continuity and momentum to simulate the dynamic behavior of flood waves. The upstream boundary condition was defined using the Probable Maximum Flood (PMF) hydrograph generated in HEC-HMS, while the downstream boundary condition was set using a normal depth assumption. Manning’s roughness coefficients were estimated based on field observations and land cover data, with values of 0.039 for the main river channel and 0.024 for the left and right overbank floodplains. The Cowan method was applied to assign these values due to its suitability for field-based estimations.
As direct calibration was not possible owing to the absence of historical flood data or observed high-water marks standard references were used to guide roughness selection, introducing some degree of uncertainty. To address this, a sensitivity analysis was performed to evaluate the influence of Manning’s n values on key hydraulic outputs, including peak breach discharge and maximum velocity. This analysis was carried out at three representative cross-sections: just downstream of the dam, mid-reach, and at the downstream outlet. The HEC-RAS outputs such as flood depth, wave velocity, and arrival time—formed critical inputs for inundation mapping and downstream hazard assessment.
2.3.4. Terrain Processing and Hazard Mapping
Accurate representation of terrain and river channel geometry was essential for simulating dam breach and downstream flood propagation. Catchment delineation for the Gomit watershed was conducted using a 30×30m resolution SRTM DEM within ArcGIS 10.1, employing Arc Hydro and HEC-GeoHMS extensions.
Terrain preprocessing steps included DEM reconditioning, sink filling, flow direction and accumulation generation, stream definition, segmentation, and watershed delineation. Key hydrologic parameters—such as catchment area, slope, and lag time were extracted. The Curve Number (CN) values were updated using recent land use and soil data provided by the Amhara Design and Supervision Enterprise, resulting in a revised average CN of 76.11, compared to the original estimate of 78.1.
For hydraulic modeling, high-resolution terrain data were acquired from detailed field surveys and validated using Global Mapper 16.1. A Triangular Irregular Network (TIN) surface was developed in ArcGIS to represent the downstream channel. Using HEC-GeoRAS, hydraulic geometry features including stream centerlines, cross-sections, bank lines, flow paths, inline structures, and storage areas were extracted. A total of 260 cross-sections were generated along a 5.4km reach downstream of the dam, spaced at 20m intervals, with tighter spacing near bends and complex terrain. These geometries were exported into HEC-RAS, refined to match surveyed profiles, and used for breach simulation and inundation mapping.
3. Results and Discussion
The hydraulic modeling executed in this study is central to understanding the breach behavior of the Gomit Dam under two primary scenarios: a sunny day failure and a Probable Maximum Flood (PMF) condition. The simulations aimed to generate breach outflow hydrographs, evaluate downstream flood behavior, and delineate inundation extents for emergency preparedness and flood risk mitigation. This section provides a comprehensive interpretation of the hydraulic outputs, discusses sensitivity analyses, and evaluates potential hazards in comparison with findings from other relevant studies.
3.1. Breach Hydrograph Analysis
The two generated breach hydrographs demonstrate markedly different flood magnitudes. Scenario-1 (sunny day failure) yielded a peak discharge of 1,493.85m3/s, Figure 2. While Scenario-2 (PMF failure) produced 1,914.26m3/s Figure 3. Both significantly exceeded the PMF inflow rate of 102.62m3/s. This indicates that the breach outflow is approximately 18.65 times greater than the PMF inflow and 1.28 times higher than the sunny-day failure peak. These findings are consistent with , who noted that breach outflows can reach up to 20 times the inflow, underscoring the catastrophic potential of such events. This range is further supported by recent hydraulic modeling studies, which confirm that breach peak discharges typically far exceed inflow volumes under both sunny-day and flood-induced failure scenarios .
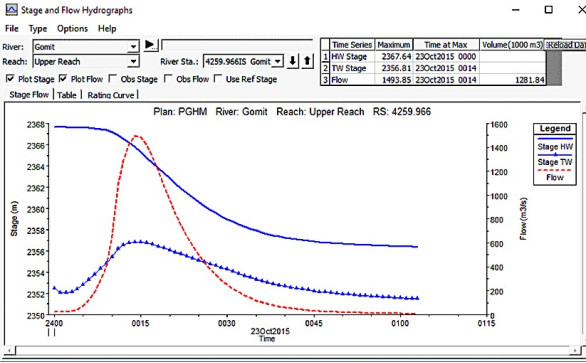
Figure 2. Scenario-1 Dam Breach flood hydrograph.
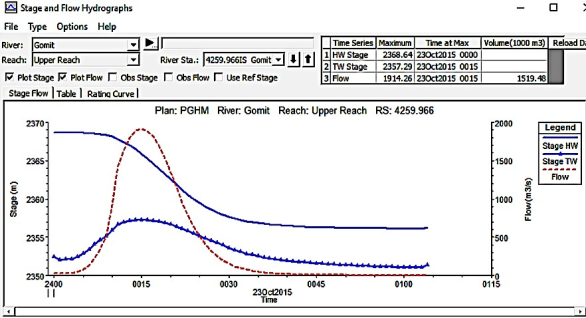
Figure 3. Senario-2- Dam Breach flood Hydrograph.
The time to breach in the study was estimated at 0.376 hours (≈22.6 minutes), with the peak outflow occurring just 0.015 hours (~54 seconds) after breaching began. Although specific timing values like this are rarely documented directly in literature, empirical models suggest that peak discharge often coincides with or follows shortly after the end of breach formation .
The substantial difference between the simulated peak outflow (1,914.26m3/s) and the empirical estimate (656.2m3/s) derived from Froehlich’s regression is primarily due to unique breach geometry particularly the deeper breach bottom elevation (25.974m) measured on-site .
Table 1 and Table 2 provide detailed hydraulic parameters across multiple downstream cross-sections for both scenarios. Peak discharges and water surface elevations gradually decline with distance from the dam, illustrating attenuation of flood intensity downstream .
Table 1. Senario-1 (Sunny day failure) simulation result summary.

River Station (m)

Qp (m3/s)

Min Ch. Elv. (m)

Max WS Elv (m)

E. G. Elev (m)

Vel_Chnl (m/s)

Flow Area (m2)

Top Width (m)

1

2

3

4

5

6

7

8

4259.966 Gomit Dam

4212.85

1497.53

2350.23

2356.82

2359.27

7.46

222.27

85.12

3940.00

1494.44

2346.91

2352.42

2355.22

7.86

204.34

87.97

3690.27

1491.36

2342.82

2348.84

2352.16

9.02

194.23

106.59

3400.00

1488.45

2340.37

2344.87

2347.55

8.29

213.15

161.50

3138.06

1485.52

2337.99

2341.52

2343.65

6.84

231.08

215.20

2878.90

1483.77

2334.20

2338.16

2341.74

9.12

178.71

123.21

2620.00

1480.26

2328.51

2334.60

2336.98

7.61

221.59

122.36

2390.58

1475.75

2326.68

2331.79

2333.97

6.87

232.41

125.55

2100.00

1470.14

2324.65

2328.92

2330.42

5.47

274.12

168.89

1820.00

1463.85

2320.94

2326.34

2327.87

6.05

271.05

172.18

1520.00

1461.36

2315.28

2320.38

2322.46

7.21

234.04

156.10

1260.00

1459.63

2308.75

2313.59

2317.01

8.83

189.01

122.11

959.99

1453.10

2304.32

2309.35

2311.24

6.72

246.96

148.29

680.00

1444.74

2300.46

2306.18

2308.65

7.16

209.06

97.88

400.00

1440.77

2295.78

2301.11

2303.95

7.97

195.50

97.00

148.14

1438.60

2291.82

2296.59

2298.50

6.87

239.60

172.77

20.00

1437.75

2290.27

2294.96

2296.93

6.60

237.96

165.90

Table 2. Senario-2 (PMF) Breach Simulation result summary.

River Station (m)

Qp (m3/s)

Min CHl Elv (m)

MAX WS Elv (m)

E. G. Elev (m)

Vel_Chnl (m/s)

Flow Area (m2)

Top Width (m)

4259.966 Gomit Dam

4212.848

1917.19

2350.23

2357.29

2360.11

8.07

264.69

99.37

3940

1913.96

2346.91

2352.83

2356.09

8.49

242.77

98.28

3690.27

1910.82

2342.82

2349.19

2352.89

9.63

234.52

121.79

3400

1908.66

2340.37

2345.11

2348.17

8.81

252.37

172.26

3138.06

1906.53

2337.99

2341.7

2344.27

7.33

271.73

231.64

2878.904

1904.9

2334.2

2338.48

2342.36

9.41

219.43

135.98

2620

1902.2

2328.51

2334.96

2337.63

7.99

267.3

134.06

2390.58

1899.1

2326.68

2332.13

2334.66

7.41

278.41

141.05

2100

1894.54

2324.65

2329.22

2330.98

5.81

325.73

179.29

1820

1890.18

2320.94

2326.65

2328.39

6.48

327.56

194.67

1520

1888.41

2315.28

2320.68

2323.03

7.61

282.88

171.89

1260

1886.67

2308.75

2313.91

2317.72

9.49

231.44

143.3

959.99

1881.93

2304.32

2309.69

2311.81

7.14

300.72

166.34

680

1875.32

2300.46

2306.63

2309.41

7.98

257.71

124.94

400

1872.06

2295.78

2301.52

2304.75

8.47

237.03

105.94

148.14

1870.92

2291.82

2296.87

2299.05

7.31

289.45

190.44

19.999

1870.17

2290.27

2295.25

2297.52

6.95

286.84

179.83

Recent studies, such as , reported peak discharges of around 570 m3/s, with flood depths reaching 16 m and velocities up to 11 m/s. While these values are higher in depth, Gomit Dam’s peak flows are significantly higher in discharge, likely due to terrain and breach size. showed catastrophic breach flows (~14,442 m3/s), demonstrating that while Gomit is a small-scale dam, the relative severity within its context remains substantial.
3.2. Hydraulic Response Analysis
The hydraulic response of the Gomit dam breach simulation indicates significant downstream hazards. Within the first kilometer, flow velocities ranged between 6 and 10m/s, and water depths reached up to 7.5m, placing critical infrastructure and communities at risk. Even at distances beyond 2km, velocities persisted at 6 to 8m/s with depths of 3 to 5m, demonstrating the sustained power of the flood wave. Inundation patterns reveal that the right overbank was more deeply affected than the left, primarily due to the flatter terrain facilitating greater lateral spread. These findings are summarized in Table 3 and illustrated in Figure 4.
These results align with previous studies: found that topographic asymmetry strongly influences flood width and depth, and observed similar behavior at other Ethiopian dams. Comparatively, conducted a sensitivity study using HEC-RAS for a larger dam and observed peak velocities of 20.85m/s, maximum flood depths of 47.4m, and peak discharges up to 244,204m3/s about 14km downstream. While the Gomit breach scenario is significantly more dangerous than smaller-scale cases, it remains far less catastrophic than large-scale sensitivity analyses, highlighting how local topography, dam size, and breach geometry critically shape hazard severity.
Table 3. Hydraulic Simulation Results at Selected Cross-Sections (Probable Maximum Flood Scenario).

River Station (RS) (m)

Q Total (m3/s)

Water Surface Elevation (m)

Max Depth (m)

Velocity Total (m/s)

3690.27

1910.82

2349.19

6.37

8.15

2878.904

1904.90

2338.48

4.28

8.68

2390.58

1899.10

2332.13

5.46

6.82

19.9988

1870.17

2295.25

4.98

6.52

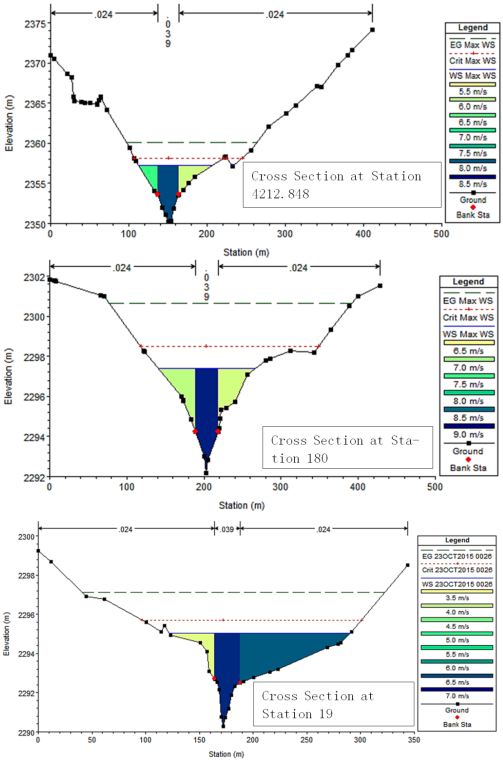
Figure 4. Cross sections showing maximum water surface elevation and flow velocity.
3.3. Sensitivity Analysis
Due to uncertainties in breach parameter estimation, only a few locations of interest have been selected, and a sensitivity analysis for the inputs Manning’s roughness and breach width has been performed.
3.3.1. Sensitivity to Manning's Roughness (n)
As shown in Table 4 and Figure 5 Increasing the channel roughness by 40% decreased peak discharge from 1873.82 m3/s to 1823.51 m3/s at station 0+600. Flow velocity decreased while water depths increased due to higher energy dissipation. This trend matches the findings of , who demonstrated that increased roughness leads to flow retardation and greater inundation depths.
Across multiple stations, water surface elevations rose by about 0.5 m as roughness increased. This has implications for flood hazard mapping and supports using conservative estimates of roughness in emergency modeling. Comparable roughness sensitivity was observed by in the Ribb Dam simulations, and similar behavior was reported for , where roughness sensitivity altered predicted flood extents.
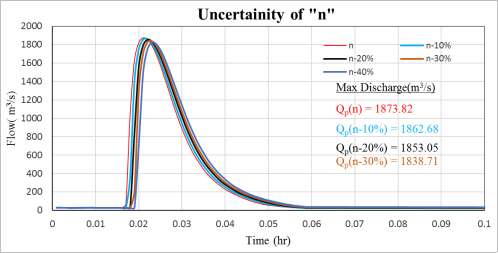
Figure 5. Uncertainty of Manning’s roughness.
Table 4. Uncertainty of Manning’s roughness.

River Station 0+600

n

n-10%

n-20%

n-30%

n-40%

River Station

0+600

QP

1873.82

1862.68

1853.05

1838.71

1823.51

Velocity

9.81

9.12

8.55

9.10

7.68

Water Surface ELV (Max)

2304.99

2305.14

2305.30

2305.40

2305.52

Max Flow Depth from RBd

5.77

5.92

6.08

6.18

6.30

Max Flow Depth

Left side

2.27

2.42

2.58

2.68

2.80

From RBn

Right side

2.21

2.36

2.52

2.62

2.74

River Station

2+540

QP

1896.23

1894.19

1892.20

1888.54

1881.07

Velocity

7.01

6.57

6.18

5.81

5.52

Water Surface ELV (Max)

2333.90

2334.04

2334.19

2334.31

2334.44

Max Flow Depth from RBd

5.68

5.82

5.97

6.09

6.22

Max Flow Depth

Left side

2.85

2.99

3.14

3.26

3.39

From RBn

Right side

2.75

2.89

3.04

3.16

3.29

River Station

3+700.31

QP

1906.41

1906.15

1903.68

1901.46

1898.61

Velocity

9.90

9.20

8.69

8.14

7.69

Water Surface ELV (Max)

2349.40

2349.53

2349.68

2349.79

2349.92

Max Flow Depth from RBd

6.73

6.86

7.01

7.12

7.25

Max Flow Depth

Left side

2.55

2.68

2.83

2.94

3.07

From RBn

Right side

2.64

2.77

2.92

3.03

3.16

Where: - RBd; River Bed (m), RBn; River Bank (m), Qp= Peak discharge (m3/s), ELV; Elevation (m) and velocity (m/s).
3.3.2. Sensitivity to Breach Width (Bw)
As summarized in Table 5 and Figure 6, increasing the breach width by 40% elevated the peak discharge at station 0+600 from 1,873.82 m3/s to 2,095.04 m3/s, an increase of 221.22 m3/s. Although velocity and water depth displayed only marginal increases, the impact on total outflow volume was significant, emphasizing breach width as a dominant factor in flood magnitude. supports this, indicating that changes in breach width produced large variations in peak outflow ranging from 35% to 87% for large reservoirs and 6% to 50% for small ones. More recent global sensitivity studies using Monte Carlo simulations (e.g., McBreach framework) have similarly identified breach width as one of the most influential parameters affecting maximum discharge, alongside breach formation time and breach elevation, often accounting for up to 85% of variability in peak flow .
Table 5. Uncertainty of Breach width.

Bfinal

Bfinal

10%-Bfinal

20%-Bfinal

30%-Bfinal

40%-Bfinal

River Station 0+600

19.37

25.97

28.57

31.17

33.77

36.36

QP

1697.42

1873.82

1933.13

1993.52

2047.09

2095.04

Velocity

9.55

9.81

9.90

9.98

10.06

10.14

Water Surface ELV (Max)

2304.83

2304.99

2305.04

2305.09

2305.14

2305.17

Max Flow Depth from RBd

5.61

5.77

5.82

5.87

5.92

5.95

Max Flow Depth From

RBn Left side

2.11

2.27

2.32

2.37

2.42

2.45

Right side

2.05

2.21

2.26

2.31

2.36

2.39

River Station 2+540

QP

1720.64

1896.23

1964.37

2016.44

2078.97

2130.98

Velocity

6.91

7.09

7.15

7.21

7.26

7.31

Water Surface ELV (Max)

2333.76

2333.90

2333.96

2334.00

2334.04

2334.08

Max Flow Depth from RBd

5.54

5.68

5.74

8.78

8.82

8.86

Max Flow Depth From

RBn Left side

2.71

2.85

2.91

2.95

2.99

3.03

Right side

2.61

2.75

2.81

2.85

2.89

2.93

River Station 3+700.31

QP

1727.44

1906.41

1974.55

2031.47

2086.37

2143.58

Velocity

9.66

9.91

9.99

10.06

10.13

10.20

Water Surface ELV (Max)

2349.25

2349.40

2349.45

2349.49

2349.53

2349.57

Max Flow Depth from RBd

6.58

6.73

6.78

6.82

6.86

6.90

Max Flow Depth From

RBn Left side

2.40

2.55

2.60

2.64

2.68

2.72

Right side

2.49

2.64

2.69

2.73

2.77

2.81

Where: - RBd; River Bed (m), RBn; River Bank (m), Qp= Peak discharge (m3/s), ELV; Elevation (m) and velocity (m/s).
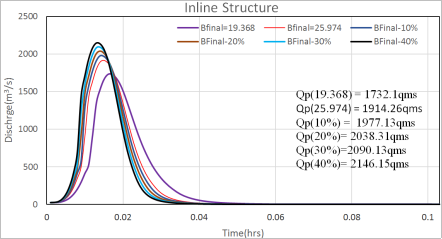
Figure 6. Uncertainty of breach width.
3.4. Inundation Mapping
The breach simulation under the worst-case scenario (Scenario 1: PMF event) was executed in HEC-RAS v5.0, with hydraulic outputs including maximum water surface elevation and flow velocity exported to ArcGIS via HEC-GeoRAS for post-processing Figure 7.
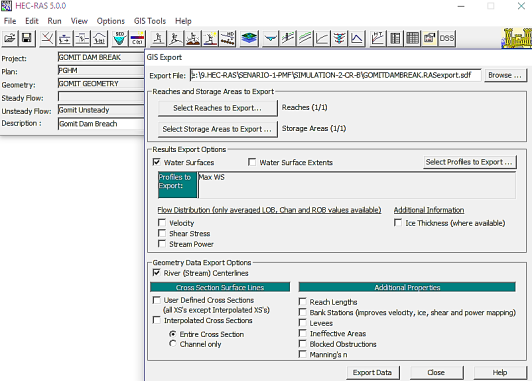
Figure 7. GIS Export option for post-processing.
A TIN surface was generated in ArcGIS, and HEC-GeoRAS tools were used to extract stream centerlines, bank lines, flow paths, and over 260 cross-sections over the 5.4 km downstream reach. Outputs such as arrival time, recession time, inundation duration, percentage time inundated, and flood boundary extent were processed in RAS Mapper to develop the inundation map Figure 8.
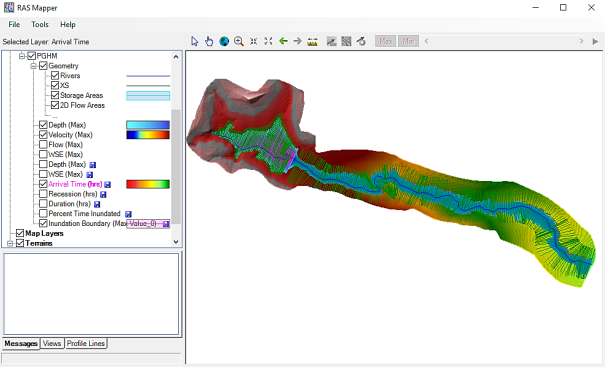
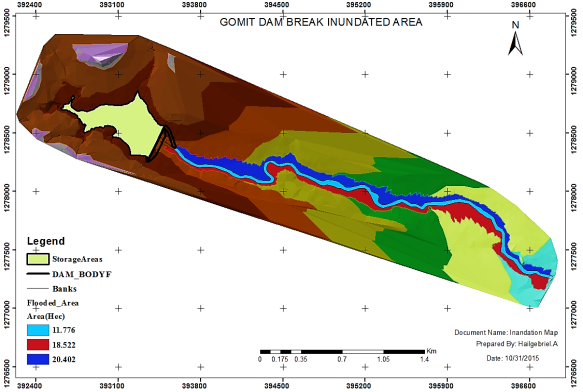
Figure 8. Flood Mapping under RAS Mapper.
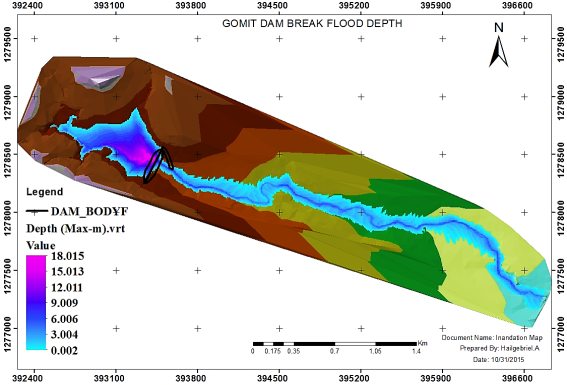
Figure 9. A & B: Inundated area and maximum water depth respectively.
The inundation maps revealed a total flooded area of 38.92 hectares, consisting of 11.78 ha within the stream channel, 18.52 ha on the right overbank, and 20.40 ha on the left overbank Figure 9. This accounts for 32.44% of the originally irrigated command area (120 ha), highlighting a significant loss in agricultural productivity and severe economic impact.
Comparing internationally, the failure of Shihmen Dam in Taiwan resulted in roughly 28% loss of command area a slightly lower proportion than Gomit’s impact . Similarly, Jema Dam breach modeling in the Abay Basin revealed inundation of approximately 41.6 km², highlighting how terrain and structure size influence flood extent . While larger-scale breach events such as Dire Dam exhibited maximum flood depths of approximately16.4m and flow velocities up to22.7m/s , and Yanda Dam simulations recorded depths of 35.2m with velocities around7.9m/s , the Gomit breach remains catastrophic when assessed relative to its scale and its impact on irrigated land.
Socially, the inundation puts 26 households at risk of food insecurity, livestock loss, and health hazards, especially during active field hours. These findings emphasize the urgency of early warning systems and post-disaster rehabilitation planning.
3.5. Hazard Classification
Flood hazard classification was conducted based on the U.S. Army Corps of Engineers depth-velocity hazard curves , which categorize zones into Low Danger, Judgment, and High Danger for both adults and children Figure 10. This analysis compares simulated breach flow depths and velocities to determine zones with potential for life-threatening risk.
The results indicate that most of the main channel and adjacent overbank areas fall within the High Danger zone. For instance, at station 2390.58, flood depth reached 3.71m with a velocity of 7.41m/s, placing it in a life-threatening category for all age groups. Similarly, at station 19.99 downstream, hazardous conditions persisted with depths up to 3.52m and velocities near 6.95m/s. Overbank depths ranged from 0.72 to 1.58m, with velocities between 4.26 and 6.80m/s.
These findings confirm that both children and adults face significant risks of injury or fatality during the breach event. Comparable hazard classifications have been reported in breach simulations for instance, modeling found maximum flood depths of 16 m and velocities up to 11 m/s, with most floodplain areas classified between middle to high hazard levels, and very high hazard zones near the riverbank. Similar risk patterns have also been documented for , where overtopping and piping scenarios generated hazard delineations based on depth and velocity effects.
This classification not only highlights the physical danger but also underlines the urgent need for hazard mitigation measures, emergency planning, and community awareness to minimize the impact of future dam failure events.
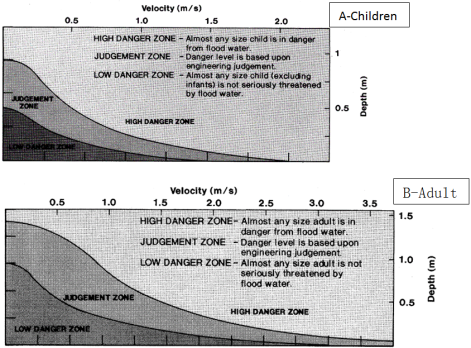
Figure 10. Classification of Danger A-children and B-adults.
4. Conclusion
This study developed and applied a dam breach model to assess the hydraulic impacts of a potential failure of the Gomit Earth Dam, which is currently under irrigation development but exhibiting critical damages such as rodent burrows and exposed clay core. Using HEC-RAS coupled with GIS-based tools (HEC-GeoRAS and RAS Mapper), the breach was simulated under Probable Maximum Flood (PMF) conditions to estimate downstream flood extent, velocity, and hazard classification.
The simulation results indicate that approximately 38.92 hectares, about 32.44% of the irrigated command area, would be inundated, leading to significant agricultural losses and socio-economic impacts. Peak breach discharge was estimated at 1914.26 m3/s near the dam, attenuating slightly downstream. High flood depths and velocities place much of the inundated area within the high hazard zone, posing serious risks to over 100 residents from 26 households, including threats to life, health, and food security.
Due to the absence of downstream hydraulic structures, model calibration was not possible; however, field survey data and sensitivity analyses on breach width and channel roughness enhanced the reliability of the results. The breach formation time was estimated at 0.376 hours, with the flood wave reaching the downstream river mouth in approximately 0.386 hours.
This study is limited by reliance on a single breach scenario and lack of observed flood data for calibration. Additionally, potential changes in breach characteristics due to structural degradation or climatic variability were not fully explored.
Future research should prioritize real-time monitoring of dam integrity, multi-scenario breach modeling, and detailed community vulnerability assessments. Incorporating land-use changes and climate variability will further improve hazard prediction accuracy. The findings underscore the critical need for emergency preparedness, structural maintenance, and community-based risk reduction strategies to mitigate the impacts of a potential dam breach and protect downstream livelihoods.
Abbreviation

COSAERAR

Commission for Sustainable Agricultural and Environmental Rehabilitation for the Amhara Region

DEM

Digital Elevation Model

D/S

Down Stream

EPA

Emergency Action Plan

GeoRAS

Geographical River Analysis System

GIS

Geographical Information System

ha

hectare

HEC-RAS

Hydrological Engineering Center – River Analysis System

IDF

Inflow Design Flood

LULC

Land Use Land Cover

m.a.s.l.

Meters above sea level

MDDL

Minimum Drawdown Level

M.E.D

Micro Earth Dam

MWL

Maximum Water Level

NPH

No Public Hazard Dam

NWL

Normal Water Level

PMF

Probable Maximum Flood

SDF

Spillway Design Flood

U/S

Up Stream

USBR

United States Bureau of Reclamation

Acknowledgments
We would like to express our sincere gratitude to the Amhara Design and Supervision Works Enterprise (ADSWE), the Bureau of Water Resource Development (BOWRD), and the National Meteorological Agency for their valuable support in providing essential data and technical documents.
Author Contributions
Sentayehu Mekonnen Beyene: Conceptualization, Data curation, Formal Analysis, Investigation, Methodology, Writing – original draft, Writing – review & editing
Hailgebriel Ayele Fikire: Software, Writing – review & editing
Data Availability Statement
All data generated and analyzed during this study are included in this published article.
Conflicts of Interest
The authors declare no conflict of interest for this publication.
References
[1] Mishra, B. K., et al., Water security in a changing environment: Concept, challenges and solutions. Water, 2021. 13(4): p. 490.
[2] Umer, Y., et al., Small-scale irrigation farming as a climate-smart agriculture practice; its adoption and impact on food security for Ethiopian smallholder farmers: a review. Asian Res J Curr Sci, 2024. 6(1): p. 163-80.
[3] Owen, J. R., et al., Catastrophic tailings dam failures and disaster risk disclosure. International journal of disaster risk reduction, 2020. 42: p. 101361.
[4] Li, Y., et al., Migration rules and risk of disaster of discharged tailings flow under typical dam failure pattern. International Journal of Geotechnical Engineering, 2025: p. 1-16.
[5] Costa, J. E., Floods from dam failures. Vol. 85. 1985: US Geological Survey.
[6] Wahl, T. L., et al. Prediction of Embankment Dam Breach Parameters A Literature Review and Needs Assessment DSO-98-004 Dam Safety. 2000.
[7] Aqilah, S. S., et al., Assessing socio-economic and environmental losses of dam-failure flood risk: A review on sustainable framework. Journal of Sustainability Science and Management, 2024. 19(1): p. 171-195.
[8] Phyo, A. P., H. Yabar, and D. Richards, Managing dam breach and flood inundation by HEC-RAS modeling and GIS mapping for disaster risk management. Case Studies in Chemical and Environmental Engineering, 2023. 8: p. 100487.
[9] Rangarirai, W., C. Marnani, and A. Rahmat. Analyzing the impact of community-based approaches on disaster preparedness to the risk of tropical cyclone induced flooding in Chimanimani District, Zimbabwe. in IOP Conference Series: Earth and Environmental Science. 2023. IOP Publishing.
[10] Commission for Sustainable Agricultural and Environmental Rehabilitation for Amhara Region (COSAERAR), Gomit Micro Earth Dam Head Design, s.l.: s.n. January 2001 E.C.
[11] Te Chow, V., Probability studies of hydrologic events and their application to hydraulic design. 1950: University of Illinois at Urbana-Champaign.
[12] Froehlich, D. C., Embankment dam breach parameters and their uncertainties. Journal of Hydraulic Engineering, 2008. 134(12): p. 1708-1721.
[13] Singh, K. P. and A. Snorrason, Sensitivity of outflow peaks and flood stages to the selection of dam breach parameters and simulation models. Journal of hydrology, 1984. 68(1-4): p. 295-310.
[14] Kiwanuka, M., et al., Dam breach analysis of Kibimba Dam in Uganda using HEC-RAS and HEC-GeoRAS. Environmental Systems Research, 2023. 12(1): p. 31.
[15] Jiang, X., Z. Zhang, and H. Deng, Influences of inflow rates on the breach characteristics of landslide dams. Frontiers in Earth Science, 2024. 12: p. 1484093.
[16] Awal, A., et al., Downstream impacts of dam breach using HEC-RAS: a case of Budhigandaki concrete arch dam in central Nepal. Environmental Systems Research, 2024. 13(1): p. 37.
[17] Gaagai, A., et al., Modeling and risk analysis of dam-break flooding in a semi-arid Montane watershed: a case study of the Yabous Dam, Northeastern Algeria. Water, 2022. 14(5): p. 767.
[18] Zhong, Q., et al., New empirical model for breaching of earth-rock dams. Natural Hazards Review, 2020. 21(2): p. 06020002.
[19] Sawai, A., Dhananjay, and L. Kumar, Dam Break Analysis -Review of Literature. 2019.
[20] TEGEGNE, B. D., Dam breach analysis and flood inundation mapping the case of Koga Dam, Abay Basin, Ethiopia. 2020.
[21] Kemal, A., Dam Breach Analysis Using HEC-RAS 2D Flow Method for Yanda Dam. Master’s thesis, Addis Ababa Universi, 2023.
[22] Cook, A. and V. Merwade, Effect of topographic data, geometric configuration and modeling approach on flood inundation mapping. Journal of hydrology, 2009. 377(1-2): p. 131-142.
[23] Duressa, J. N. and A. K. Jubir, Dam break analysis and inundation mapping, case study of fincha’a dam in horro guduru wollega zone, oromia region, Ethiopia. Science Research, 2018. 6(2): p. 29-38.
[24] Gudeta, S. W., Dam break modelling by using HEC-RAS and HEC-GEO RAS: a case study of Dire embankment dam on legadad river. International Journal of Engineering Technology and Scientific Innovation, 2022.07.
[25] Karki, A., et al., Dam breach analysis and parameter sensitivity analysis along a river reach using HECRAS. Stavební Obzor-Civil Engineering Journal, 2022. 31(4): p. 571-585.
[26] Schmocker, L. and W. H. Hager, Modelling dike breaching due to overtopping. Journal of Hydraulic Research, 2009. 47(5): p. 585-597.
[27] Worku, F., Dam Breach Modelling and Flood mapping, a Case Study of Ribb Dam. Master’s thesis, Addis Ababa Universi, 2023.
[28] Leoul, A. and N. Kassahun, Dam breach analysis using hec-ras and hec-georas: The case of kesem kebena dam. Open Journal of Modern Hydrology, 2019. 9(4): p. 113-142.
[29] Bello, D., et al., Influence of dam breach parameter statistical definition on resulting rupture maximum discharge. Water, 2022. 14(11): p. 1776.
[30] Contributors, W., Shihmen Dam. Wikipedia, The Free Encyclopedia., 17 March 2025 01:28 UTC.
[31] Mulu, A. S., M. Z. Belayneh, and B. L. Dadi, Dam Breach Modeling And Inundation Mapping: A Case Study Of Jema Dam, Abay Basin, Ethiopia. International Journal of Creative Research Thoughts (IJCRT),
[32] Reclamation, U. S. D. o. T. I. B. o., Downstream hazard classification guidelines. 1988.
Cite This Article
  • APA Style

    Beyene, S. M., Fikire, H. A. (2025). Dam Breach Flood Prediction and Mapping: A Case Study of Gomit Small Dam, Amhara Region. Research and Innovation, 1(1), 83-99. https://doi.org/10.11648/j.ri.20250101.21

    Copy | Download

    ACS Style

    Beyene, S. M.; Fikire, H. A. Dam Breach Flood Prediction and Mapping: A Case Study of Gomit Small Dam, Amhara Region. Res. Innovation 2025, 1(1), 83-99. doi: 10.11648/j.ri.20250101.21

    Copy | Download

    AMA Style

    Beyene SM, Fikire HA. Dam Breach Flood Prediction and Mapping: A Case Study of Gomit Small Dam, Amhara Region. Res Innovation. 2025;1(1):83-99. doi: 10.11648/j.ri.20250101.21

    Copy | Download

  • @article{10.11648/j.ri.20250101.21,
      author = {Sentayehu Mekonnen Beyene and Hailgebriel Ayele Fikire},
      title = {Dam Breach Flood Prediction and Mapping: A Case Study of Gomit Small Dam, Amhara Region},
      journal = {Research and Innovation},
      volume = {1},
      number = {1},
      pages = {83-99},
      doi = {10.11648/j.ri.20250101.21},
      url = {https://doi.org/10.11648/j.ri.20250101.21},
      eprint = {https://article.sciencepublishinggroup.com/pdf/10.11648.j.ri.20250101.21},
      abstract = {The Gomit Earth Dam, constructed for irrigation, is currently in a critical state due to structural damage and exposure of the clay core, posing a significant risk of catastrophic failure. This study simulates the potential breach flood under probable maximum flood (PMF) conditions and delineates flood inundation extents to assess impacts on downstream areas and inform mitigation strategies. The research employs five key software tools: Global Mapper, ArcGIS, HEC-RAS, HEC-GeoRAS, and RAS Mapper to model dam breach hydraulics and map flood inundation. Field-surveyed topographic data with 20-m interval cross-sections were used to create accurate terrain representations. Simulations were conducted for two scenarios: sunny day failure and PMF failure, with detailed flood hazard analysis focusing on the PMF scenario. Results indicate a peak breach outflow of 1914.26 m3/s, 1.28 times greater than sunny day failure and 18.65 times the PMF inflow, with flood depths ranging from 7.06 m near the dam to 0.72–1.58 m across overbanks downstream. Flow velocities reached up to 12.32 m/s, and the flood wave arrival time varied from 0.077 to 0.386 hours after breach initiation. The inundated area totals approximately 38.92 hectares, representing 32.44% of the irrigated command area, with significant implications for agriculture, infrastructure, and community safety. Approximately 26 households, totaling over 100 people, are at high risk of life-threatening impacts, food insecurity, and property damage. This study underscores the urgent need for structural maintenance, early warning systems, and community-based flood risk management. Limitations include a lack of observed flood data for model calibration and consideration of a single flood scenario. Future research should incorporate multiple breach scenarios, long-term monitoring, and the impacts of climate variability to enhance the preparedness and resilience of irrigation infrastructure.},
     year = {2025}
    }
    

    Copy | Download

  • TY  - JOUR
    T1  - Dam Breach Flood Prediction and Mapping: A Case Study of Gomit Small Dam, Amhara Region
    AU  - Sentayehu Mekonnen Beyene
    AU  - Hailgebriel Ayele Fikire
    Y1  - 2025/12/19
    PY  - 2025
    N1  - https://doi.org/10.11648/j.ri.20250101.21
    DO  - 10.11648/j.ri.20250101.21
    T2  - Research and Innovation
    JF  - Research and Innovation
    JO  - Research and Innovation
    SP  - 83
    EP  - 99
    PB  - Science Publishing Group
    SN  - 3070-6297
    UR  - https://doi.org/10.11648/j.ri.20250101.21
    AB  - The Gomit Earth Dam, constructed for irrigation, is currently in a critical state due to structural damage and exposure of the clay core, posing a significant risk of catastrophic failure. This study simulates the potential breach flood under probable maximum flood (PMF) conditions and delineates flood inundation extents to assess impacts on downstream areas and inform mitigation strategies. The research employs five key software tools: Global Mapper, ArcGIS, HEC-RAS, HEC-GeoRAS, and RAS Mapper to model dam breach hydraulics and map flood inundation. Field-surveyed topographic data with 20-m interval cross-sections were used to create accurate terrain representations. Simulations were conducted for two scenarios: sunny day failure and PMF failure, with detailed flood hazard analysis focusing on the PMF scenario. Results indicate a peak breach outflow of 1914.26 m3/s, 1.28 times greater than sunny day failure and 18.65 times the PMF inflow, with flood depths ranging from 7.06 m near the dam to 0.72–1.58 m across overbanks downstream. Flow velocities reached up to 12.32 m/s, and the flood wave arrival time varied from 0.077 to 0.386 hours after breach initiation. The inundated area totals approximately 38.92 hectares, representing 32.44% of the irrigated command area, with significant implications for agriculture, infrastructure, and community safety. Approximately 26 households, totaling over 100 people, are at high risk of life-threatening impacts, food insecurity, and property damage. This study underscores the urgent need for structural maintenance, early warning systems, and community-based flood risk management. Limitations include a lack of observed flood data for model calibration and consideration of a single flood scenario. Future research should incorporate multiple breach scenarios, long-term monitoring, and the impacts of climate variability to enhance the preparedness and resilience of irrigation infrastructure.
    VL  - 1
    IS  - 1
    ER  - 

    Copy | Download

Author Information