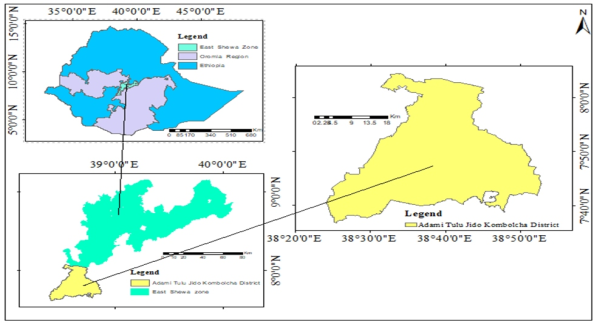
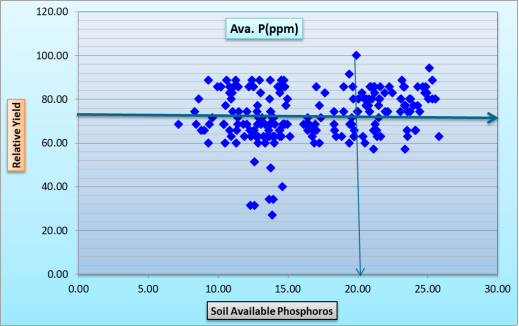
Agricultural production and land productivity have been declining due to various factors, with unbalanced fertilizer application identified as a major cause. To address this issue, soil test-based crop response fertilizer recommendations offer an effective solution. An on-farm experiment was conducted in Adami Tulu Jido Kombolcha district over three consecutive cropping seasons (2022-2024) to determine the optimum nitrogen (N) level, phosphorous critical level (Pc), and phosphorus requirement factor (Pf) for bread wheat production. In the first year, fifteen factorial treatments combining five nitrogen levels (0, 23, 46, 69, and 92 kg/ha) and four phosphorus levels (0, 23, 46, and 92 kg/ha) were tested using a randomized complete block design with three replications on 9m² plots. Bread wheat variety Kingbird was used as the test crop. In the subsequent two years, the optimum nitrogen rate (46 kg/ha) identified in the first year was uniformly applied, while five phosphorus levels (0, 10, 20, 30, and 40 kg/ha) were evaluated to determine phosphorus critical level and requirement factor. Grain yield data were analyzed using SAS statistical software with mean comparisons by LSD at p<0.05, and partial budget analysis was conducted using CIMMYT guidelines. Results showed significant differences among treatments, with the highest grain yield of 3296.5 kg/ha obtained from the combined application of 46 kg/ha N and 69 kg/ha P, while the control plot yielded 2330.2 kg/ha. The economically optimum nitrogen rate was 46 kg/ha, with phosphorus critical level and phosphorus requirement factor determined as 19.92 ppm and 2.38, respectively. These findings provide essential parameters for soil test-based fertilizer recommendations to enhance bread wheat productivity in Adami Tulu Jido Kombolcha district.
| Published in | Research and Innovation (Volume 2, Issue 1) |
| DOI | 10.11648/j.ri.20260201.11 |
| Page(s) | 1-8 |
| Creative Commons |
This is an Open Access article, distributed under the terms of the Creative Commons Attribution 4.0 International License (http://creativecommons.org/licenses/by/4.0/), which permits unrestricted use, distribution and reproduction in any medium or format, provided the original work is properly cited. |
| Copyright |
Copyright © The Author(s), 2025. Published by Science Publishing Group |
Soil Test-based, Fertilizer Application, Productivity Increase, Economic Benefit
S.N | Parameters | Mean | Minimum | Maximum | Classification | References |
|---|---|---|---|---|---|---|
1 | pH | 6.69 | 6.28 | 6.86 | Near Neutral | [8] |
2 | TN (%) | 0.13 | 0.12 | 0.14 | Low | [4] |
3 | OC (%) | 1.46 | 1.32 | 1.59 | Very low | [4] |
4 | Ava. P (mg/kg) | 5.58 | 4.43 | 6.79 | Very low | [4] |
5 | CEC (mg/kg) | 6.60 | 5.64 | 8.12 | Very low | [4] |
Treatment No. | N (kg/ha) | P2O5 (kg/ha) | Mean Grain Yield (kg/ha) | Total Variable Cost (₨/ha) | Gross Income (₨/ha) | Net Benefit (₨/ha) |
|---|---|---|---|---|---|---|
1 | 0 | 0 | 2475.30 | 0 | 99012 | 99012 |
2 | 23 | 0 | 2740.73 | 1750 | 109629.2 | 107879.2 |
3 | 46 | 0 | 2666.60 | 3500 | 106664 | 103164 |
4 | 69 | 0 | 2358.00 | 5250 | 94320 | 89070 |
5 | 92 | 0 | 2944.40 | 7000 | 117776 | 110776 |
6 | 0 | 46 | 2930.86 | 4477 | 117234.4 | 112757.4 |
7 | 23 | 46 | 2364.19 | 6227 | 94567.6 | 88340.6 |
8 | 46 | 46 | 3117.30 | 7977 | 124692 | 116715 |
9 | 69 | 46 | 2824.08 | 9727 | 112963.2 | 103236.2 |
10 | 92 | 46 | 2327.15 | 11477 | 93086 | 81609 |
11 | 0 | 92 | 2746.90 | 8954 | 109876 | 100922 |
12 | 23 | 92 | 3098.76 | 10704 | 123950.4 | 113246.4 |
13 | 46 | 92 | 2626.54 | 12454 | 105061.6 | 92607.6 |
14 | 69 | 92 | 3166.66 | 14204 | 126666.4 | 112462.4 |
15 | 92 | 92 | 3055.55 | 15954 | 122222 | 106268 |
Level of N (kg/ha) | Level of Phosphorous (P2O5) (kg/ha) | |||
|---|---|---|---|---|
0 | 23 | 46 | 92 | |
0 | 1775e | 2554cd | 3030a | 2746b |
23 | 2740b | 2565cd | 2351cd | 3098a |
46 | 2666bc | 3093a | 3117.9a | 2691bc |
69 | 2358cd | 2516cd | 2824ab | 3066a |
92 | 2944ab | 2706bc | 2327d | 3055a |
CV (%) | 12.47 | |||
LSD (5%) | 312 | |||
No. | N Rate (kg/ha) | P2O5 Rate (kg/ha) | Grain Yield (kg/ha) | Biomass Yield (kg/ha) | Harvest Index (%) |
|---|---|---|---|---|---|
1 | 46 | 0 | 2330.2b | 7524.7b | 48.02b |
2 | 46 | 23 | 2810.0ab | 8427.5ab | 49.25ab |
3 | 46 | 46 | 3057.9ab | 8006.2ab | 49.39ab |
4 | 46 | 69 | 3296.5a | 8373.5ab | 52.68a |
5 | 46 | 92 | 2459.7b | 8759.3a | 47.73b |
CV (%) | 17.77 | 15.5 | 14.33 | ||
LSD (5%) | 633.52 | 466.79 | 3.81 | ||
Phosphorus Rate (kg/ha) | Average Soil Phosphorus (ppm) | Change in Phosphorus over Control (ppm) | Phosphorus Requirement Factor (Pf) |
|---|---|---|---|
0 | 3.6 | 0 | 0 |
10 | 10.13 | 6.53 | 1.55 |
20 | 14.84 | 4.71 | 3.15 |
30 | 24.99 | 10.15 | 2.46 |
40 | 31.63 | 6.64 | 4.76 |
Average | 2.38 | ||
CEC | Cation Exchange Capacity |
PF | Phosphorous Requirement Factor |
ETC | Ethiopian Birr |
OC | Organic Carbon |
LSD | Least Significance Difference |
SOC | Soil Organic Carbon |
MARR | Marginal Average Rate of Return |
RCBD | Randomized Complete Block Design |
PC | Phosphorous Critical |
TN | Total Nitrogen |
| [1] | Admassu, L. (2017). Soils test phosphorous calibration for Tef [Eragrostis tef(Zucc.) Trotter] production on nitisols of Central Ethiopian Highlands. American-Eurasian Journal of Agricultural & Environmental Sciences 17(4), 320-331. |
| [2] |
Agegnehu, G., Nelson, P. N., Bird, M. I., & van Beek, C. (2015). Phosphorus response and fertilizer recommendations for wheat grown on nitisols in the Central Ethiopian Highlands. Communications in Soil Science and Plant Analysis, 46(19), 2411-2424.
https://doi.org/10.1080/0010 3624.2015.1081922 |
| [3] | Alem L, Joseph M, Kethers S, Steele C, Wilkin son R. 2008. Information environments for supporting consistent registrar medical handover. HIM J; 37(1): 9-25. |
| [4] | Altieri, M. A. 2018. Agroecology: the science of sustainableagriculture. CRC Press. |
| [5] | Bekalu Abebe and Mamo Manchore. 2016. Effect of the Rateof N-Fertilizer Application on Growth and Yield of Wheat (Triticum aestivum L.) at Chencha, Southern Ethiopia. International Journal of Plant, Animal and EnvironmentalSciences 6(3): 168-175. |
| [6] | CIMMYT (International Maize and Wheat Improvement Center).1998. From agronomic data to farmer recommendations: Aneconomic workbook. CIMMYT, Mexico. |
| [7] | CSA (Central Statistical Agency). (2015). Report on Area and Crop Production forecast for Major Crops (for private Peasant Holdings Meher’ season). Addis Ababa, Ethiopia. |
| [8] | CSA (Central Statistical Agency). 2016. Agricultural sample survey report on area and production of major crops: Privatepeasant holdings in meher season of 2015/2016 (Vol. I, No. 584). CSA, Addis Abeba, Ethiopia. |
| [9] | Dejene Getahun, Dereje Girma, Abreham Feyisa, AjemaLemma, and Lello Dejene. 2020. Verification of Soil Test Crop Response Based Phosphorus Recommendation on Bread Wheat (Triticum Aestivum L.) in Yaya Gulele District of North Shewa Zone, Oromia. International Journal of Applied Agricultural Sciences. Vol. 6, No. 3, pp. 52-56. |
| [10] | Edelstein, D. M., & Tonjes, D. J. (2012) Modeling an improvement in phosphorus utilization in tropical agriculture. Journal of Sustainable Agriculture, 36(1), 18-35, |
| [11] | Fufa, B., and R. M. Hassan. 2005. Stochastic Technology and Crop Production Risk: The Case of Small-Scale Farmers in East Hararghe Zone of Oromia Regional State in Ethiopia, Strategies and Analysis for Growth and Access. Ethiopia. |
| [12] | Hussain, I., Khan, M. A., & Khan, E. A. (2006). Bread wheat varieties as influenced by different nitrogen levels. Journal of Zhejiang University of Science, 7(1), 70-78. of Science, 7(1), 70-78. |
| [13] | Kefyalew Assefa, Tilahun Firomsa, and Tadesse Hunduma (2017). Phosphorus Critical Level and Optimum Nitrogen Rate Determination on Teff for Sustainable Soil Fertility Management and Economical Teff Production at Lume Area of Oromia Region, Ethiopia. Journal of Biology, Agriculture and Healthcare, No. 19, 2017. |
| [14] | Mulugeta Eshetu, Daniel Abegeja, Regassa Gosa, Tesfaye Ketama, Girma Getachew, Tilahun Chibsa. Soil Test Based Crop Response Phosphorus Calibration Study for Bread Wheat Production in Sinana District of Bale Zone, Southeastern Ethiopia. International Journal of Science and Qualitative Analysis. Vol. 8, No. 1, 2022, pp. 1-12. |
APA Style
Workineh, M., Kitila, K. (2025). Soil Test Crop Response Based Phosphorus Calibration Study on Bread Wheat (Triticum Aestivum L.) in Adami Tulu Jido Kombolcha District, East Showa, Oromia, Ethiopia. Research and Innovation, 2(1), 1-8. https://doi.org/10.11648/j.ri.20260201.11
ACS Style
Workineh, M.; Kitila, K. Soil Test Crop Response Based Phosphorus Calibration Study on Bread Wheat (Triticum Aestivum L.) in Adami Tulu Jido Kombolcha District, East Showa, Oromia, Ethiopia. Res. Innovation 2025, 2(1), 1-8. doi: 10.11648/j.ri.20260201.11
@article{10.11648/j.ri.20260201.11,
  author = {Mekonnen Workineh and Kasahun Kitila},
  title = {Soil Test Crop Response Based Phosphorus Calibration Study on Bread Wheat (Triticum Aestivum L.) in Adami Tulu Jido Kombolcha District, East Showa, Oromia, Ethiopia},
  journal = {Research and Innovation},
  volume = {2},
  number = {1},
  pages = {1-8},
  doi = {10.11648/j.ri.20260201.11},
  url = {https://doi.org/10.11648/j.ri.20260201.11},
  eprint = {https://article.sciencepublishinggroup.com/pdf/10.11648.j.ri.20260201.11},
  abstract = {Agricultural production and land productivity have been declining due to various factors, with unbalanced fertilizer application identified as a major cause. To address this issue, soil test-based crop response fertilizer recommendations offer an effective solution. An on-farm experiment was conducted in Adami Tulu Jido Kombolcha district over three consecutive cropping seasons (2022-2024) to determine the optimum nitrogen (N) level, phosphorous critical level (Pc), and phosphorus requirement factor (Pf) for bread wheat production. In the first year, fifteen factorial treatments combining five nitrogen levels (0, 23, 46, 69, and 92 kg/ha) and four phosphorus levels (0, 23, 46, and 92 kg/ha) were tested using a randomized complete block design with three replications on 9m² plots. Bread wheat variety Kingbird was used as the test crop. In the subsequent two years, the optimum nitrogen rate (46 kg/ha) identified in the first year was uniformly applied, while five phosphorus levels (0, 10, 20, 30, and 40 kg/ha) were evaluated to determine phosphorus critical level and requirement factor. Grain yield data were analyzed using SAS statistical software with mean comparisons by LSD at p<0.05, and partial budget analysis was conducted using CIMMYT guidelines. Results showed significant differences among treatments, with the highest grain yield of 3296.5 kg/ha obtained from the combined application of 46 kg/ha N and 69 kg/ha P, while the control plot yielded 2330.2 kg/ha. The economically optimum nitrogen rate was 46 kg/ha, with phosphorus critical level and phosphorus requirement factor determined as 19.92 ppm and 2.38, respectively. These findings provide essential parameters for soil test-based fertilizer recommendations to enhance bread wheat productivity in Adami Tulu Jido Kombolcha district.},
 year = {2025}
}
TY  - JOUR
T1  - Soil Test Crop Response Based Phosphorus Calibration Study on Bread Wheat (Triticum Aestivum L.) in Adami Tulu Jido Kombolcha District, East Showa, Oromia, Ethiopia
AU  - Mekonnen Workineh
AU  - Kasahun Kitila
Y1  - 2025/12/20
PY  - 2025
N1  - https://doi.org/10.11648/j.ri.20260201.11
DO  - 10.11648/j.ri.20260201.11
T2  - Research and Innovation
JF  - Research and Innovation
JO  - Research and Innovation
SP  - 1
EP  - 8
PB  - Science Publishing Group
SN  - 3070-6297
UR  - https://doi.org/10.11648/j.ri.20260201.11
AB  - Agricultural production and land productivity have been declining due to various factors, with unbalanced fertilizer application identified as a major cause. To address this issue, soil test-based crop response fertilizer recommendations offer an effective solution. An on-farm experiment was conducted in Adami Tulu Jido Kombolcha district over three consecutive cropping seasons (2022-2024) to determine the optimum nitrogen (N) level, phosphorous critical level (Pc), and phosphorus requirement factor (Pf) for bread wheat production. In the first year, fifteen factorial treatments combining five nitrogen levels (0, 23, 46, 69, and 92 kg/ha) and four phosphorus levels (0, 23, 46, and 92 kg/ha) were tested using a randomized complete block design with three replications on 9m² plots. Bread wheat variety Kingbird was used as the test crop. In the subsequent two years, the optimum nitrogen rate (46 kg/ha) identified in the first year was uniformly applied, while five phosphorus levels (0, 10, 20, 30, and 40 kg/ha) were evaluated to determine phosphorus critical level and requirement factor. Grain yield data were analyzed using SAS statistical software with mean comparisons by LSD at p<0.05, and partial budget analysis was conducted using CIMMYT guidelines. Results showed significant differences among treatments, with the highest grain yield of 3296.5 kg/ha obtained from the combined application of 46 kg/ha N and 69 kg/ha P, while the control plot yielded 2330.2 kg/ha. The economically optimum nitrogen rate was 46 kg/ha, with phosphorus critical level and phosphorus requirement factor determined as 19.92 ppm and 2.38, respectively. These findings provide essential parameters for soil test-based fertilizer recommendations to enhance bread wheat productivity in Adami Tulu Jido Kombolcha district.
VL  - 2
IS  - 1
ER  -
Oromia Agricultural Research Insistitute, Adami Tulu Agricultural Research Center, Batu, Ethiopia
Oromia Agricultural Research Insistitute, Adami Tulu Agricultural Research Center, Batu, Ethiopia