2. Related Works
The availability of educational data in education institution which the result of automation in education institution is one factor that lead to emergence of EDM and the use of machine learning in education. Recent advancement in AI specially in ML and deep learning is another factor that lead interest in this area. In Ethiopia the introduction of automation to support performance recording provides an opportunity for interested researchers to conduct a study on students’ performance using ML and EDA techniques. There are researches that are conducted in this respect
.
In this section of the paper we present a literature review related in to the use of ML and EDA in educational sector. We try to show the importance and benefits of ML and EDA techniques in this sector by presenting related papers. We also indicate the methodologies and related strategies (for instance the actual ML algorithm used, etc.) employed by different researchers.
1) Prediction of Students Performance using Machine learning by J. Dhilipan et al
The article by Dhilipan et al. (2021)
mentions that predicting student performance is challenging due to lack of large datasets and lack of established frameworks. According to the author the proliferation of machine learning techniques are crucial tools in predicting student performance
| [9] | Albreiki, B., Zaki, N., & Alashwal, H. (2021). A systematic literature review of student performance prediction using machine learning techniques. Education Sciences, 11(9), 552. https://files.eric.ed.gov/fulltext/EJ1314372.pdf |
| [14] | Mohammed, J., Ayde, A., & Bedaso, M. (2023). Predicting undergraduate students' achievement in Ethiopian higher learning institutions by employing a machine learning approach (MSc Thesis). Jimma University.
https://repository.ju.edu.et/handle/123456789/8136 |
[9, 14]
. The related work section of this article talks about previous studies on predicting students’ performance using decision trees, clustering, and other ML algorithms like Naive Bayes and SVM. Some studies achieved around 89-90% accuracy.
The methodology section states data collection, feature transformation, model training, and deployment. Regarding to the data collection authors collected student marks of 10th and 12th grades and previous semester. One issues that may be raised here is that, the authors did not specify how they collected the data. Also, the features used are only academic marks and attendance, but other factors like socio-economic status or engagement weren’t considered, which could improve predictions. Then they conducted feature engineering which is used to transform raw data into predictive feature. They tested several machine learning models: Binomial Logistic Regression, Decision Tree, Entropy, and K-NN. Though they compare different algorithms they did not mentions how they split the data into training/testing.
Regarding the result and findings, highest accuracy was for Binomial Logistic Regression at 97.05%, followed by K-NN at 93.71%, Entropy at 91.19%, and Decision Tree at 88.23%. Here logistic regression outperforms prior studies, this is one of the strengths of the paper. Another strength of the work is that that author has constructed a software system which make use of the model to predict at-risk students using low marks and attendance.
The study contributes a practical framework for predicting student performance in academic institutions but has critical limitations:
a) Small sample size (e.g., 34 samples in K-NN results) risks overfitting.
b) Lack of detailed data preprocessing and validation steps hampers replication.
In conclusion the article demonstrates the viability of ML in academic prediction, particularly with Logistic Regression. Nonetheless, future research should
a) Expand datasets with demographic and behavioral features.
b) Validate models through cross-institutional studies.
2) Prediction of Student's Performance Using Machine Learning by Nupur Chauha et al
Another paper in the area of students’ performance predication by ML is the paper by I. Nupur Chauha et al
. Most of the section on this paper focus on literature reviews and survey. Here is a summary of the review of the paper.
One early pioneer in student performance predication using ML was a study by Paulo Cortez and Alice Silva back in 2008. They came up with a way to predict student performance by looking at how students behaved when using online learning systems. They found that tracking things like how students interact with these systems, alongside their academic records, was really important for predicting their success. By using clever methods, they were able to get over 80% accuracy in their predictions. They even saw a significant boost in accuracy, up to 25.8%, when they used "ensemble methods"—which basically means combining several ML models to get a better overall prediction.
Another important contribution came from Bertram Haskins in 2017. Haskins explored using artificial neural networks (ANNs) and decision trees to spot students who might be struggling. Their study showed pretty good accuracy (over 77%) and sensitivity (over 83%). This research really highlighted that ML isn't just about predicting outcomes, but also about helping teachers take better decisions and give students personalized support.
When it comes to the actual ML methods,
classification and
regression are the most common. Classification models help identify things like who might drop out of school. For example, Dekker and others (2009) used classification to pinpoint dropout risks. Abu Amrieh and colleagues (2016) made these predictions even more reliable by using ensemble methods. Regression models, on the other hand, are great for predicting continuous outcomes, like a student's GPA. Thai-Nghe and others (2011) used multi-relational factorization models to predict student grades, showing how things like course difficulty and student aptitude influence results. More recent studies, such as one by Prasad and Remya (2018), confirmed that
linear regression and
support vector machines (SVMs) are very effective for analyzing large academic datasets.
| [18] | Rahman, M., Islam, S., & Hasan, M. (2024). Predicting academic success using hybrid machine learning models. Education and Information Technologies, 29, 789–812.
https://doi.org/10.1007/s10639-023-12045-y |
| [16] | Kaur, P., & Singh, M. (2023). Machine learning techniques for student performance prediction: A comparative study. Computers and Education: Artificial Intelligence, 4, 100109.
https://doi.org/10.1016/j.caeai.2023.100109 |
[18, 16]
A recurring theme in all these studies is the importance of "feature engineering". Pojon (2017) showed that including details like historical academic records and participation in extracurricular activities really made a difference in prediction accuracy. Cortez and Silva (2008) also found that behavioral data, such as how often students log in or turn in assignments, could boost prediction accuracy by a significant 22–25%.
Traditional systems often just tell you if a student will pass or fail, which isn't always helpful in practice. More recent developments are trying to offer dynamic support. Xu and colleagues (2015) came up with a prediction system that adapts as a student's performance changes. The current study by Chauhan et al. (2019) builds on this by using multiple linear regression (MLR) to predict GPA and then suggests targeted tutoring based on a student's specific academic weaknesses. They tested this approach with computer science students and found that internal assessment scores (like marks from theory exams, practicals, and vivas) were strong predictors. Their system showed very low error rates and high accuracy.
In conclusion, the paper states that predicting student performance is evolving. According to the paper there is a move away from simple pass/fail models to more sophisticated systems that can provide detailed insights and offer practical recommendations. While good ML algorithms and careful feature engineering are still crucial, the ability to give students personalized support, like tutoring, marks a significant step forward. Future research might explore combining insights from student behavior with real-time performance tracking to create even more effective ways to help students succeed
| [10] | Dhilipan, J., Kumar, R., & Prakash, S. (2021). Prediction of students’ performance using machine learning. IOP Conference Series: Materials Science and Engineering, 1055, 012122. https://doi.org/10.1088/1757-899X/1055/1/012122 |
| [20] | Kumar, V., Sharma, S., & Patel, R. (2025). Explainable artificial intelligence for student performance prediction. Journal of Educational Data Mining, 17(1), 1–25.
https://doi.org/10.5281/zenodo.10456789 |
[10, 20]
.
Predication of students’ performance using ML has been conducted by different researchers in Ethiopia. Most of these research focus using either data mining or machine learning approaches. Below we provide the review of three local research papers in the area related with this.
3) Students’ Performance Prediction based on their Academic Record by Berhanu, Fiseha et al
This paper with a title “
Students’ Performance Prediction based on their Academic Record”
aims to deeply understand students and their education setting in order to improve academic performance. The authors take the advantage of the increased data in educational environment which is required both in data mining and machine learning. The main method used in the study use Educational Data mining (EDM) which is the application of data mining in educational setting.
They have used 5 years (2009-2014) academic related data of undergraduate student from the department of Horticulture in Dilla University. The dataset includes two type of data. One of the data set is about students’ academic performance before joining the Institution which has 8 attribute and the other is students’ five-year academic performance in the Institution (49 attribute). After conducting extensive data pre-processing to prepare the data for EDM, they have trained their model using decision tree.
Specifically, a decision tree algorithm is implemented using RM tool, on pre-processed 49 attributes of 199 records; a total of 27 rules were generated. The result of decision tree model reveals that specific courses, student academic status in 1st and 2nd year and sex are attributes that determine the performance of student.
| [15] | Belachew, E. B., & Gobena, F. A. (2017). Student performance prediction model using machine learning approach: The case of Wolkite University. International Journal of Advanced Research in Computer Science and Software Engineering, 7(2), 46–50. https://doi.org/10.23956/ijarcsse/V7I2/01219 |
| [19] | Zhang, J., Chen, Q., & Liu, P. (2023). Feature engineering for student performance prediction in educational data mining. Knowledge-Based Systems, 263, 110273.
https://doi.org/10.1016/j.knosys.2023.110273 |
[15, 19]
Regarding the effectiveness and efficiency of the model, they computed it in terms of recall and precision. Based on the year of the students in the Institution, precision range from 60% to 89% while recall ranges from 79% to 100%. The overall accuracy of the model is also calculated to be 84.95%.
The main limitation of the paper is the number of datasets used for training. The dataset size (199) is very small for most machine learning algorithms. In addition, the dataset does not have diversity only limited to a single University student which reduces its generalizability.
4) Analysis and Prediction of Students’ Academic Performance Using Machine Learning Approaches by Wayesa Fikadu et al
Another research related on predication of academic students’ using machine learning approach is the research by Girman and Fekadu from Wachemo University, Ethiopia
.
Their research paper entitled “
Analysis and Prediction of Students’ Academic Performance Using Machine Learning Approaches” employees machine learning methods. The research objective is to analyse and predict at-risk students using machine learning classification models (Decision Tree, Naive Bayes, and K-NN) to provide early warning systems
. They aim to answer three research questions about important predictive factors, the best ML model, and how stakeholders can use this information.
The paper starts by discussing how machine learning is transforming education through personalized learning platforms. The authors highlight challenges in predicting performance due to various internal and external factors affecting students. They position their work as using a hybrid approach combining both academic and non-academic data.
The methodology section describes their process: problem identification with domain experts, data collection from both internal university systems and external questionnaires, preprocessing (cleaning missing values, normalization), feature extraction, and model training/testing with an 80- 20 split. They used RapidMiner for preprocessing.
The data section is quite detailed. They collected data from 5,000 students (though only 3,200 completed questionnaires). The dataset combines internal academic records (CGPA, attendance, etc.) with external factors from questionnaires (demographics, habits, environment). They organized these into 7 classes with numerous parameters.
For methods, they implemented three classification algorithms: Decision Tree (using gain ratio), Naive Bayes, and K-NN. Evaluation metrics included accuracy, precision, recall, and F1-score. They tested models separately on academic-only, non-academic-only, and mixed data.
The results show K-NN outperformed others significantly with 100% accuracy on mixed data. Decision Tree achieved 84.34% and Naive Bayes 81.32% on mixed data.
Key findings emphasize that mixed data (academic + non-academic) yields best results, with K-NN being the most accurate model. They note that data integration matters more than algorithm choice for prediction quality. The 100% K-NN accuracy seems unusually high - possibly due to data characteristics or preprocessing.
This paper is not without limitation. The most obvious limitation is the data constraints due to COVID-19 in data collections, which likely affected both the quantity and quality of data. The geographic limitation to a single Ethiopian university (Wachemo University) is significant too - cultural, educational, and socioeconomic factors specific to this context may limit generalizability. Technically, the exclusion of modern algorithms like neural networks or ensemble methods feels like a methodological limitation, especially since they cited deep learning in future work. The 80/20 train-test split without k-fold cross-validation might raise eyebrows for ML practitioners too.
5) Analysis and Prediction of Students’ Academic Performance Using Machine Learning Approaches by Jewar Mohammed et al
Another paper related to the use of machine learning make decision that checks student achievement is the paper by Jewar Mohammed; Amanuel Ayde; Muktar Bedaso with a title
“Predicting Undergraduate Students' Achievement In Ethiopian Higher Learning Institutions By Employing A Machine Learning Approach”
. This master thesis is aimed at finding out the important factors that determine student achievement from data in electronic academic records. The second aim of the study is identifying the important machine learning algorithms for predicting students’ academic achievements.
The researcher employed the design science research (DSR) method for conducting the study with the following five steps Data Collection: Gathering data (from selected universities), Data Preprocessing: Cleaning the dataset by removing noisy profiles, completing missing information, and eliminating unnecessary data. The researcher also conducted feature selection which involves identifying the most applicable features to achieve optimal accuracy for the classifier model, using Recursive Feature Elimination (RFE) to determine variables that contribute most to predicting the target attribute. Finally, model is constructed which involves building machine learning models (Decision Tree, Logistic Regression, Random Forest, K-Nearest Neighbors) to predict student achievement, with data split into 80% for training and 20% for testing). The final step is model evaluation comparison. The model comparison findings indicated that the Random Forest classifier was the most appropriate for the given datasets, consistent with other research suggesting its reliability and strong predictive power. Specifically
a) Random Forest: Achieved 100% accuracy in several experiments with different random state values (e.g., random state = 0, 4, 10). The average accuracy for Random Forest with 10-fold cross-validation was 99.2%. It also showed 100% in precision, recall, and F1-Score.
b) K-Nearest Neighbor (KNN): Achieved accuracies of 93.7%, 95.5%, 94.9%, and 95.5% for experiments with random states 0, 10, 20, and 40 respectively. Its 10-fold cross-validation accuracy was 93.9%.
c) Logistic Regression: Achieved 99% accuracy with a random state of 4 and 98.9% with a random state of 10. Its 10-fold cross-validation accuracy was 78.8%.
d) Support Vector Machine (SVM): Achieved 97% accuracy with random state 0, 96% with random state 4, and 95.9% with random state 10. Its 10-fold cross-validation accuracy was 99.3%.
e) Naïve Bayes: Achieved 94% accuracy with random state 0, 62% with random state 4, and 64% with random state 10. Its 10-fold cross-validation accuracy was 63.8%.
The study also identified significant factors influencing student achievement. Specifically the listed out the top ten attributes affecting student achievement.
Like the other previous paper this paper has also limitation of its own. A key limitation highlighted by the researcher is the absence of certain important attributes in the database that could significantly aid decision-making. Another limitation is related with the scope of the study. The study's scope was restricted to predicting undergraduate student achievement using data from the student registry systems of Bonga University and Mizan Tepi University. While these universities were chosen for their representativeness of similar institutions and diverse student backgrounds, the findings are assumed to be valid inputs for other universities.
Student Performance Prediction Model using Machine Learning Approach: The Case of Wolkite University by Erimiyas Birihnu et Al
This is a similar research
| [8] | Belachew, E. B, & Gobena, F. A. (2017). Student performance prediction model using machine learning approach: The case of Wolkite University. International Journal of Advanced Research in Computer Science and Software Engineering, 7(2), 46–50. https://doi.org/10.23956/ijarcsse/V7I2/01219 |
| [12] | Berhanu, F., & Abera, A. (2015). Students’ performance prediction based on their academic record. International Journal of Computer Applications, 131(13), 36–41.
https://www.researchgate.net/publication/291019494 |
[8, 12]
to the previous research summarized in this study that uses similar approaches and similar research question only the data used is different – the case of Wolkite University. The purpose of the study is to predict student performance in college of computing student at Wolkite University based on students’ previous GPA and course taken by students. Specifically, the objective of the study was
a) Apply ML classification techniques to historical student transcript data.
b) Evaluate the predictive accuracy of Neural Networks (MLP), Naive Bayesian (NB), and Support Vector Machines (SMO - Sequential Minimal Optimization).
c) Identify the most effective algorithm for this specific context and dataset.
The dataset used for the study is obtained from Wolkite University Registrar database pertaining to college of Computing and Informatics. data from the four department in the Computing and Informatics College for the period of 2004-2007 is used in the study. The study uses transcript data from 993 students across these four departments in the College of Computing and Informatics from 2004 to 2007 EC (Ethiopian Calendar)
The researchers used three machine learning algorithms: Neural Networks (MLP), Naive Bayesian, and Support Vector Machine (SMO). They implemented these in WEKA software - is developed and used at the University of Waikato in New Zealand -and evaluated performance using 10-fold cross-validation.
The key finding was that Naive Bayesian outperformed the other methods, achieving up to 95.7% accuracy for Information Technology students in 2006.
Neural Network (MLP): Achieved moderate accuracy (45.7% - 80.6%), but had the longest execution times (1.39 - 11.77 seconds), scaling with data size/complexity.
Support Vector Machine (SMO): Achieved moderate accuracy (51.4% - 83.9%), with execution times faster than MLP but slower than NB (0.05 - 0.16 seconds).
Limitation of the study include
a) Limited Scope in terms data used for the study- they use only one college from out of seven college existing in the University
b) Data factor: The study employed only academic transcript data (grades and GPS). Other important non-academic or psychosocial factors known to influence performance (e.g., socioeconomic background, motivation, learning environment, teaching quality, student engagement) is not used for the study.
c) Algorithm Scope: Only three ML algorithms were evaluated. Exploring other algorithms (e.g., Random Forests, Gradient Boosting, Deep Learning) or ensemble methods could potentially yield further improvements.
In summary the paper as a significant case study for researchers focusing on Educational Data Mining (EDM) in developing higher education contexts. Though the paper uses modest data for developing a model, it is highly recommended and advised to extend the research by extending the data to include other non-academic data and to include student records from other colleges and department. In addition it also recommended to include other ML algorithms including ensemble methods.
Table 1. Summary of Literature Review.
No | Author and Year | Feature Size | Dataset Size | Machine Learning Algorithms | Best Algorithm | Best Algorithm accuracy (%) |
1. | J. Dhilipan et al (2021) | Not stated | Not stated | Binomial Logistic Regression, Decision Tree, Entropy, and K-NN | Binomial Logistic Regression | 97.05% |
2 | Nupur Chauha et al (2019) | Not stated | Not stated | KNN, Decision Tree, SVM, Random Forest, Multiple Linear Regression | Multiple Linear Regression | 94% |
3 | Berhanu, Fiseha et (2015) | One of the data types has 8 attributes and the other data type has 49 attributes | 199 records | Decision tree | Decision tree | 84.95% |
4 | Wayesa Fikadu et al (2023) | They organized features into 7 classes with numerous parameters | 3,200 records | Decision Tree, Naive Bayes, and K-NN | KNN | 100% |
5 | Jewar Mohammed et al (2020) | | | Random Forest, K-Nearest Neighbors (KNN), Logistic Regression, Support Vector Machines (SVM), Naive Bayes | | |
6 | Ermiyas Birihanu et al (2017) | 34 features were collected and 11 features used for model training | 1071 record | Neural Net (MLP), Naïve Bayesian, Support Vector Machine | Naïve Bayesian | 90.21% |
4. Research Methodology
This section presents the dataset description, preprocessing techniques, prediction models, and evaluation strategies used in this study.
4.1. Dataset Identification and Structure
The dataset used for the project is TVET student data. This data is categorized into: Training-related Information (type of training, mode of training, training start, training end, practical result), application and enrollment details (applied by, applied for, applied for uc, application), personal and demographic information (age, sex, marital status, disability, educational level), employment information (employment condition, main sector) of each student. Specifically, the data used in this paper is data from all students registered for training in 2019 GC in TVET education center in Addis Ababa.
Table 2. The following table provides descriptions for the field of the data.
| Field Name | Data Type | Description |
1 | Sex | string | gender of candidates. |
2 | Age | int | age of the candidates. |
3 | Practical result | string | candidates' practical result (satisfactory/ unsatisfactory). |
4 | Disability | string | whether candidate has disability or not. |
5 | type of training | string | it indicates the type of training the candidate has taken it may be formal training, informal training, or short-term training |
6 | Applied for | string | whether candidates applied for practical knowledge or both practical & knowledge. |
7 | Applied for uc | string | Describes whether the candidate applied for a Unit of Competency or a Qualification. |
8 | Applied by | string | Indicates whether the candidate applied individually or through a college. |
9 | Mode of training | string | describes how the candidates learned their education. |
10 | Employment condition | string | Indicates the employment status of the candidate (employed or unemployed). |
11 | Education level | string | contains candidates' education level. |
12 | Application | string | Specifies whether the candidate's application is new or a re-application. |
13 | Status | string | Describes the final assessment result (Competent or Not yet competent). |
14 | Marital status | string | candidates’ marital status. |
15 | Training start | string | Start date of the training. |
16 | Training end | string | End date of the training. |
The actual data incorporated in the study is found from population datasets of all TVET institutions in Addis Ababa in excel format. The files were organized according to the recorded month in different folders and the excel files classified based on sub-city. The file naming and the features/columns naming were inconsistent. Records for nine months in folders are January, February, March, JULY, AUGEST, SEPTEMBER, OCTOBER, NOVEMBER and DECEMBER. A total of 40 excel files with combined size of 22.2 MB was source of the original data. Since the dataset includes all TVET data for Addis Ababa in year 2019, it could be considered as population data for Addis Ababa year 2019. The preprocessing section states in detail on how the preprocessing is done. The total number of records acquired for the study is only 19,680 records is used for the study.
4.2. Data Pre-processing
The preprocessing is conducted on the 19,680 data that all the value for 16 features. One of the challenges encountered in this study was that the acquired data was not ready for immediate processing. As stated in the previous section, the data was scattered across various Excel files. The major problems and difficulties with the data include the following:
1) Sex column used different formats such as F, M, female, male, Male, and Female.
2) Data inconsistency and spelling error in the field mode of training and type of training
3) Various type of data inconsistency among different file for the field employment condition
4) Marital status field also contained inconsistent representations.
5) Format inconsistency exists across different excel files
6) High volume of missing data. For instance, fields such as wereda, knowledge result, city, and region had a significant number of missing values.
7) Typographical and spelling errors in some of the data.
8) Some fields had completely missing values
The data profiling, which is part of Exploratory Data Analysis (EDA), serves as an initial step to provide an overview of the dataset. Importantly, it helps identify the preprocessing tasks required. This data profiling was conducted using the ‘ydata-profiling’ package in Python. We converted inconsistent data into standardized values. Additionally, we dropped some columns such as woreda, city, and region due to a high volume of missing data. Rows with missing values in critical fields were also removed from the dataset.
One important step in preprocessing is encoding categorical values into numerical values. Most columns in our dataset contain categorical data. We encoded these into a consistent numerical format — for example, 'Female' = 0 and 'Male' = 1. The remaining categorical fields were encoded in a similar manner.
We also normalized the data in our dataset using ‘StandardScaler ()’ package in python to bring all features to a similar scale. Scaling ensures that each feature contributes equally to the model, prevents features with large values from dominating, and helps algorithms converge faster and more reliably.
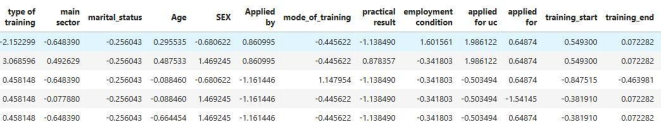
The result of the preprocessing and EDA (Explanatory Data Analysis) is expressed in the ydata result attached with this report.
Figure 1. The result of the preprocessing and EDA.
4.3. Prediction Models
To predict students' academic performance, we used various machine learning models, including Random Forest Classifier, Decision Tree, K-Nearest Neighbors (KNN) Classifier, Naïve Bayes Classifier, Neural Network, Support Vector Machine (SVM), and Logistic Regression. Random Forest is an ensemble learning method that builds multiple decision trees and merges their outputs. It works well with both categorical and numerical data and handles missing values and outliers effectively. Since we encoded our data to numerical data, this model can work in our case. A Decision Tree is a simple, tree-like structure where data is split based on decision rules derived from feature values. We thought that this model can work well in our case because the nature of our data is fine for this model. KNN model does not create the learning model instead it uses previous data (training data) to classify new coming data (testing data) based on the majority class of its 'k' nearest neighbors. It works well with well-structured data but can be sensitive to feature scaling and irrelevant features. The Naïve Bayes Classifier is a probabilistic machine learning algorithm based on Bayes’ Theorem, which describes the probability of a class given some observed features. Since our data is mostly categorical it calculates the probabilities of co-occurrences from the previous data, and work on that way. Neural Networks are inspired by the human brain and consist of interconnected layers of nodes (neurons). They can capture complex patterns in data but require more computational power and data. They perform well in high- dimensional and non-linear problems. SVM aims to find the optimal hyperplane that best separates classes in the feature space. It is effective in high-dimensional spaces and performs well even when the number of features exceeds the number of samples. Logistic Linear Regression is a linear model used for binary or multi-class classification.
We split our dataset into training and testing sets using 10-fold cross-validation. In this approach, the data is divided into 10 equal parts (folds). In each iteration, one-fold is used as the test set while the remaining nine folds are used for training. The model is trained and evaluated 10 times, each time with a different fold as the test set. Finally, the average performance across all 10 folds is calculated to provide a more reliable estimate of the model’s effectiveness.
5. Results and Discussion
This section provides the performance result we get from the experimentation on each model in terms of accuracy, precision, recall and f1-score and we compared previous results with our model performance.
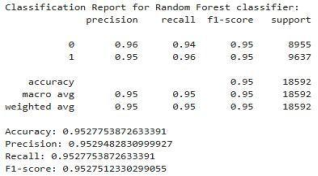
Random Forest Classifier
Figure 2. Random Forest Classifier.
The Random Forest Classifier achieved an overall accuracy of 95%. Both classes, 'Competent' and 'Incompetent', show strong precision, recall, and F1-scores, all around 0.94-0.96. This indicates a well-balanced performance in correctly identifying both categories of student performance. The macro and weighted averages further support this consistent performance across classes.
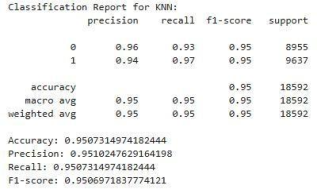
KNN
Figure 3. The KNN classifier.
The KNN classifier also demonstrated a high overall accuracy of 95%. For Class 0 ('Incompetent'), the recall is slightly lower at 0.93 compared to its precision of 0.96. Conversely, Class 1 ('Competent') shows a higher recall of 0.97 with a precision of 0.94. Despite these minor variations, the F1-scores for both classes are identical at 0.95, indicating good overall effectiveness. The macro and weighted averages confirm this strong performance.
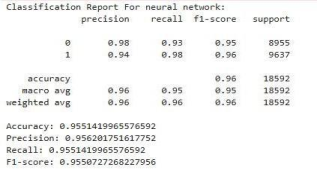
Neural Network
Neural Network is another model we used in this paper. It is capable of learning complex patterns from the data through multiple layers of interconnected neurons. After training the model on our dataset, we evaluated its performance and gained the following results:
The Neural Network model also achieved an accuracy of 95%. It shows very high precision (0.98) for Class 0 ('Incompetent') but a slightly lower recall (0.93) for this class. For Class 1 ('Competent'), it has high recall (0.98) and a precision of 0.94. The F1-score for Class 1 is slightly higher (0.96) than for Class 0 (0.95). The macro and weighted averages (precision 0.96, recall 0.95, F1-score 0.95) indicate robust performance. This model appears particularly strong at correctly identifying 'Competent' students (high recall for class 1) and ensuring that students classified as 'Incompetent' are indeed so (high precision for class 0).
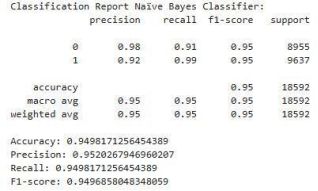
Naïve Bayes Classifier
We also checked Naïve Bayes Classifier in our work and get the following results.
Figure 5. The Naïve Bayes Classifier.
The Naïve Bayes Classifier achieved around (95%). It shows high precision (98%) for Class 0 (Incompetent) but low recall (0.91). For Class 1 ('Competent'), it has high recall (0.99) and a precision of 0.92.
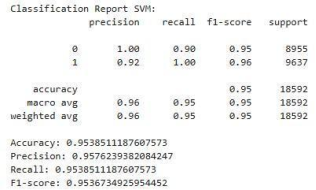
SVM
The Support Vector Machine (SVM), achieved around (95%). It shows high precision (100%) for Class 0 (Incompetent) but low recall (0.90). For Class 1 ('Competent'), it has high recall (1.0) and a precision of 0.92.
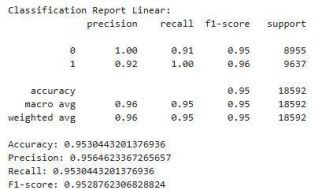
Linear Regression
Figure 7. The Linear Regression.
The Linear Regression achieved around (95%). It shows high precision (100%) for Class 0 (Incompetent) but low recall (0.90). For Class 1 ('Competent'), it has high recall (1.0) and a precision of 0.92.
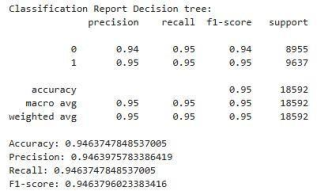
Decision Tree
Figure 8. The Decision Tree.
The Decision Tree achieved around (94%). It shows precision (94%) for Class 0 (Incompetent) and recall (95%). For Class 1 ('Competent'), it has recall (95%) and a precision of 95.